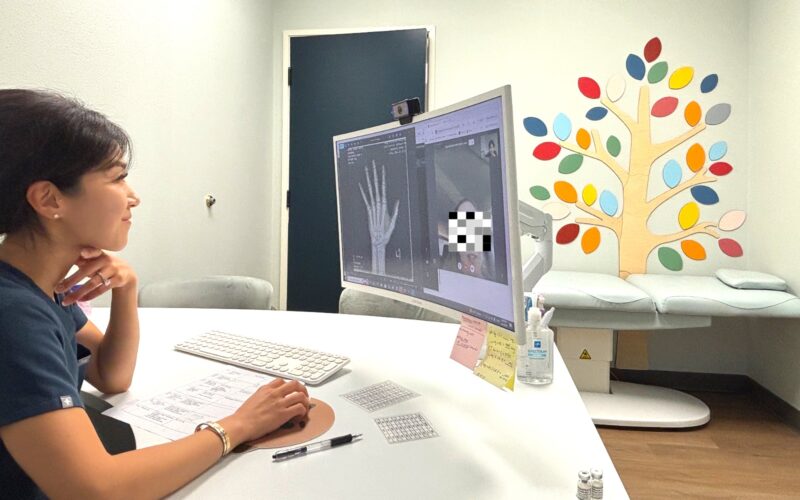

“Last year she was at the 70th percentile. This year the pediatrician said 50th. Nobody explained why the number moved.”
“He’s still growing. He’s just not growing as fast as he used to. Is that a problem, or is that just what happens?”
“I asked if we should be concerned, and I got a shrug. I left with more questions than I came in with.”
If your child’s growth chart looked different at this year’s checkup than it did last year, that quiet unsettled feeling you have is completely reasonable. A percentile is not just a number on a page. It is the one concrete piece of data parents are handed once a year to measure whether their child is on track, and when that number shifts, it is natural to wonder what changed and whether anyone actually looked closely enough to tell you.
I’m Sunjo Chung, a Nurse Practitioner at I Grow Clinic. Alongside Dr. Choi, a board certified physician, I have helped guide nearly 3,000 children through their growth journeys, including a great number of families who came to us with exactly this question.
Here is something I want to say plainly, because it does not get said enough in a standard pediatric visit. Most general pediatric appointments are 15 to 20 minutes long, covering vaccines, development, nutrition, and whatever else came up that day. A percentile drop is often noted, filed away as something to watch, and the family is sent home with a plan to simply recheck next year. That is not a failure of your pediatrician. It reflects how little time general pediatric care has to dig into a growth pattern specifically. The team at I Grow Clinic was built because this exact gap exists, and because a family deserves a real answer.
Why Families Trust I Grow Clinic
| Credential | Detail |
|---|---|
| Children guided | Over 3,000 with precision growth strategies |
| Treatment retention | 95 percent rate, reflecting exceptional outcomes and family trust |
| Approach | Meticulous 1:1 personalized management using AI driven bone age analysis |
| Medical Director | Board Certified by the American Board of Physical Medicine and Rehabilitation (ABPMR) |
| Experience | 20+ years specializing in Pediatric Growth and Developmental PM&R |
| Reputation | 5 Star Google Rating with numerous testimonials |
| Telehealth | Available in CA, NY, WA, FL, and TX |
By the end of this article, you will understand what a percentile drop actually means, which patterns are genuinely reassuring, which ones deserve a closer look, and how a bone age evaluation gives you the one piece of information a growth chart alone cannot.
Why Did My Child’s Percentile Drop?
Here is what most parents are never told, and it is the single most useful thing you can learn from this article.
One of the more common reasons a healthy child’s percentile appears to drop has nothing to do with illness, hormone deficiency, or a shrinking growth window. It is a pattern called idiopathic bone age advancement, and it works almost like a reverse illusion.
Some children mature skeletally a little ahead of their calendar age for reasons that are not tied to any disease. In early childhood, this shows up as a child who looks tall for their age and often sits in a high percentile, sometimes the 75th, 80th, even 90th. But because their skeleton is maturing faster than the calendar suggests, their growth naturally begins to slow earlier than their peers. As classmates who were maturing on a more typical timeline start their own growth spurts and catch up, the child who looked ahead of the pack now appears to be falling behind on paper. The percentile line drops, sometimes by a noticeable margin, and it can look concerning if you are only looking at the chart.
A study following 55 prepubertal children with this exact pattern, bone age running more than 2 standard deviations ahead of chronological age, found that height percentile did decline significantly over time, just as the parents in that study would have observed. But here is the finding that matters most. When those children reached adulthood, their final height did not differ from their midparental height, the height predicted by averaging their parents’ heights. Boys landed at about 172 cm compared to a predicted 171 cm. Girls landed at about 160.5 cm compared to a predicted 159 cm. Their puberty started, lasted, and produced growth entirely within the normal range. In other words, the percentile drop that caused real worry along the way did not carry into adulthood. By the time these children finished growing, their height matched their family’s expected range, as if the drop had never happened.
This pattern is different from bone age advancement caused by an underlying hormonal or medical condition, where adult height genuinely can be affected. The idiopathic version is common in children with a higher body mass index or early signs of adrenarche, and once other causes have been ruled out, it typically needs nothing more than monitoring.
🔍 To understand how bone age can run ahead of or behind the calendar, read: Bone Age vs. Chronological Age: Is Your Child’s Biological Clock Ticking Too Fast?
This does not mean every percentile drop is this benign pattern. It means a percentile drop by itself cannot tell you which of three things is actually happening. It could be this normal, self resolving bone age pattern. It could be ordinary variation within a healthy growth trajectory. Or it could be a true medical cause that genuinely needs attention. The chart looks the same in all three cases. Only a proper evaluation tells you which one you are looking at.
How Much Growth Is Normal, and When Should I Be Concerned?
Parents often ask me for a number they can hold onto, and there is a reasonably clear one.
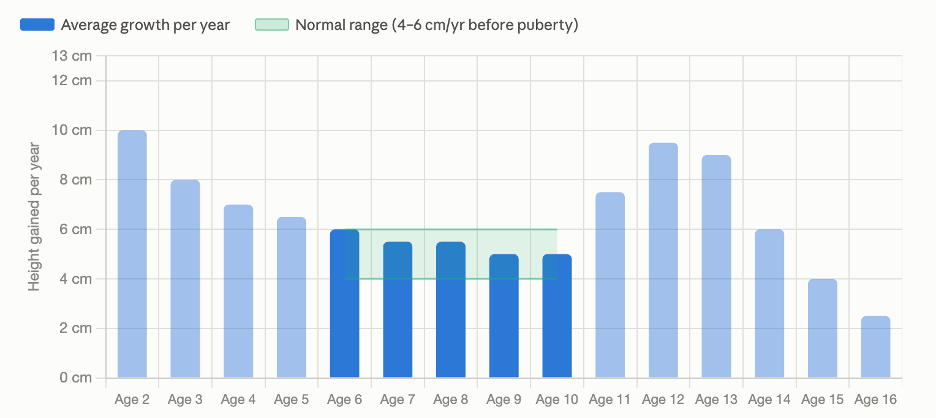
For children from about age 6 through the years before puberty begins, a normal height velocity is approximately 4 to 6 cm per year, a little over an inch and a half to nearly 3 inches. This is the range most healthy, typically developing children fall into year over year.
On the growth chart itself, the widely used clinical guideline is that crossing more than 2 major percentile lines is what defines a growth pattern worth a closer look, rather than ordinary variation. A child who moves from the 60th to the 55th percentile in a year has not crossed a major line. A child who moves from the 75th to the 25th has crossed several, and that pattern deserves attention regardless of the underlying cause.
Being short is not automatically the same thing as growth failure. A child can sit at the 5th percentile their entire childhood, track that same line consistently, and be perfectly healthy. What matters far more than where a child sits on the chart is whether they are tracking their own consistent line or whether that line is changing.
Visual Timeline: Reading Your Child’s Growth Pattern
Picture 3 different children, all currently in the 40th percentile at age 9.
Child A has been in the 40th percentile since age 3. Steady line, no crossing. This is a textbook example of a child growing exactly the way they are expected to.
Child B was in the 80th percentile at age 5 and has been sliding down since, the kind of pattern a parent would describe as falling off the growth curve. If bone age testing shows their skeleton is running ahead of their calendar age with no other findings, this often fits the idiopathic pattern described above, one that typically resolves to a normal predicted adult height.
Child C was in the 60th percentile last year and sits at the 25th this year, crossing more than 2 major percentile lines, the threshold that moves a pattern from ordinary variation into one worth a closer look.
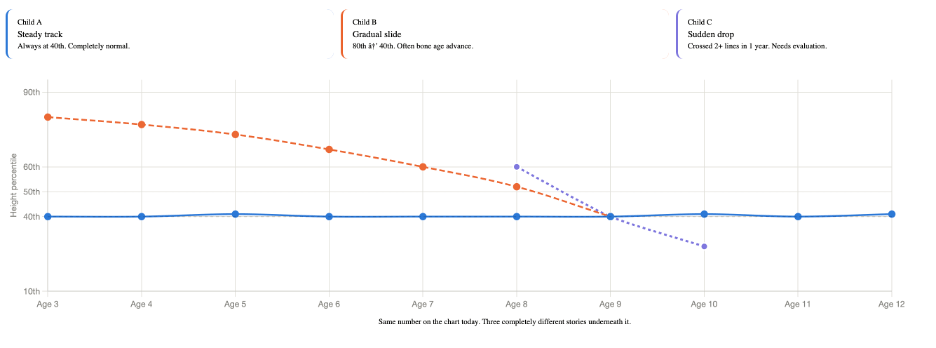
Three children, same current percentile, three very different stories. This is exactly why the number alone is not enough.
🔍 For a deeper look at how growth plates factor into these patterns as children get closer to puberty, read: What Age Do Growth Plates Close? A Parent’s Guide to the Biological Clock

What Does a Growth Evaluation Include, and Why Does Bone Age Matter?
A thorough growth evaluation is more layered than most families expect, and it is worth knowing what a complete one actually includes so you can recognize whether your child has truly been evaluated or simply measured.
It starts with history. Birth history, including birth weight and length. Any medications the child takes. Certain stimulants used commonly for treatment of conditions like ADHD, narcolepsy and anticonvulsants used for treatment of seizure disorders and steroids, can affect growth in children. Family growth patterns, including whether either parent was a late bloomer or went through puberty earlier or later than average. This is followed by a physical exam that looks at body proportions and signs of early puberty, along with a check for any physical features that might point toward a genetic cause.
From there, the two most clarifying pieces of data are a bone age study and, when required, a set of screening labs. The bone age study is a simple, low dose X-ray of the left hand and wrist. It reveals the true skeletal maturity of your child’s growth plates. Screening labs, when the history or growth pattern suggests they are needed, typically include a complete blood count, inflammatory markers, basic metabolic panel, thyroid function, IGF-1, and a celiac disease screen, since celiac disease can quietly slow growth for months before any digestive symptoms appear.
It is worth knowing that in children with a genuinely normal growth velocity and an unremarkable history and exam, these labs rarely turn up a new diagnosis. This is not a reason to skip the workup. It is exactly why the workup matters: it is often what allows a family to move from uncertainty to a confirmed, evidence-based reassurance, rather than a guess.
At I Grow Clinic, we take the bone age study further with AI enhanced analysis, comparing your child’s growth plates against thousands of reference data points with a level of precision that goes beyond what the human eye alone can consistently deliver. This gives us more than just a bone age number. It gives us a real picture of how much growth potential your child likely has left, and a realistic projected adult height, whether that turns out to be reassuring news or the starting point for a specific plan.
🔍 To understand the physical signs that can accompany a closing growth window, read: How Do You Know If Growth Plates Are Closed? 3 Key Signs Parents Often Miss
A Real Family’s Experience: Getting an Answer, Not Just a Recheck
A mother brought her 8 year old daughter to us after her pediatrician noted a percentile drop from the 75th to the 40th over the course of a year. She had already been told twice to simply come back in a year and recheck. She told me she did not want another year of not knowing.
Her daughter’s bone age study showed skeletal maturity running ahead of her calendar age, with no other findings on exam or labs. We explained the pattern in detail, including that this kind of advancement, when isolated, tends to resolve into a completely normal adult height that matches the child’s genetic potential from her parents. We also explained what we would continue to monitor and why, and gave her a realistic projected adult height range based on the AI enhanced analysis rather than a vague reassurance.
The mother told us afterward that what mattered most was not just hearing “don’t worry.” It was understanding exactly why, with real data behind it, and knowing that if anything changed at the next check, someone would already have a full picture of her daughter’s growth to compare against. She has since referred 2 other families to us, both of whom, it turned out, had very different growth stories that needed a different kind of plan. You can read more about real treatment outcomes on our website. That is the outcome we are built for either way.
When Should I Seek a Specialist for My Child’s Growth?
Consider requesting a growth evaluation if any of the following describe your child:
- Your child’s percentile has crossed 2 or more major lines on the growth chart within a year or two
- Height velocity has clearly slowed to noticeably less than about 4 cm per year in the years before puberty
- Your child’s height sits more than 3 standard deviations below the average for their age and sex
- There is no sign of puberty by age 12 in a girl or age 14 in a boy
🔍 If your concern is specifically about a son nearing his mid-teens rather than a younger child, this companion piece covers that scenario directly: Think Your Son Will Keep Growing After 16? Here’s What Most Parents Miss
A Promise from I Grow Clinic
Watching a number on a growth chart shift downward, especially when no one in the exam room took the time to explain why, can leave you carrying a worry you cannot quite name. You are not imagining it, and you are not overreacting for wanting a real answer. Every growth milestone matters, and the parents who come to us are doing exactly what good parents do: they keep asking until someone listens.
Ready to Get a Real Answer About Your Child’s Growth?
We believe every family deserves a real answer about their child’s growth. Whether your child’s story turns out to be one of the reassuring patterns described here or one that calls for a specific treatment plan, our approach is the same: careful evaluation, AI enhanced bone age analysis tailored to your child’s individual growth pattern, and a conversation that actually explains what we found, what it means specifically for your child, and why it matters.
Because our care is concierge and personally supervised by Dr. Choi, new patient openings are limited each week to protect the quality of that 1:1 attention. Whether you are in Southern California or connecting with us through our telehealth program in New York, Texas, Washington, or Florida, we would be glad to give your family the clarity you are looking for.
🔍 To read more about why we built our clinic around exactly this kind of clarity, read: Why I Started a Growth Hormone Clinic
FAQ: What Parents Ask About Their Child’s Height Percentile Drop
1. Is it normal for a healthy child’s percentile to drop as they get older?
Yes, in a substantial number of cases. Small shifts within the same general range are common and not a cause for concern. Even larger drops can reflect a benign, self-resolving pattern such as isolated bone age advancement, particularly when growth velocity and overall health remain normal.
2. How many percentile lines can my child cross before it becomes a concern?
Crossing more than 2 major percentile lines is the general threshold used to distinguish ordinary variation from a pattern that deserves closer evaluation. A smaller shift within 1 line is typically not concerning on its own.
3. What is bone age advancement, and does it mean my child’s growth window is closing early?
Bone age advancement means a child’s skeletal maturity is running ahead of their calendar age. When it happens on its own, without an underlying hormonal cause, it often means the growth window is shifting earlier rather than closing early in a way that reduces final height.
4. Will my child still reach a normal adult height if their bone age is ahead of their calendar age?
Often, yes. Research following children with this isolated pattern found their eventual adult height closely matched their mid-parental height prediction. This is different from bone age advancement caused by an underlying medical condition, which is why a full evaluation matters.
5. What tests will be run if my child’s percentile drops?
A thorough evaluation typically includes a detailed history, a physical exam, a bone age X-ray, and, when indicated by the findings, screening blood work.